
Basic Stock Searcher
Overview
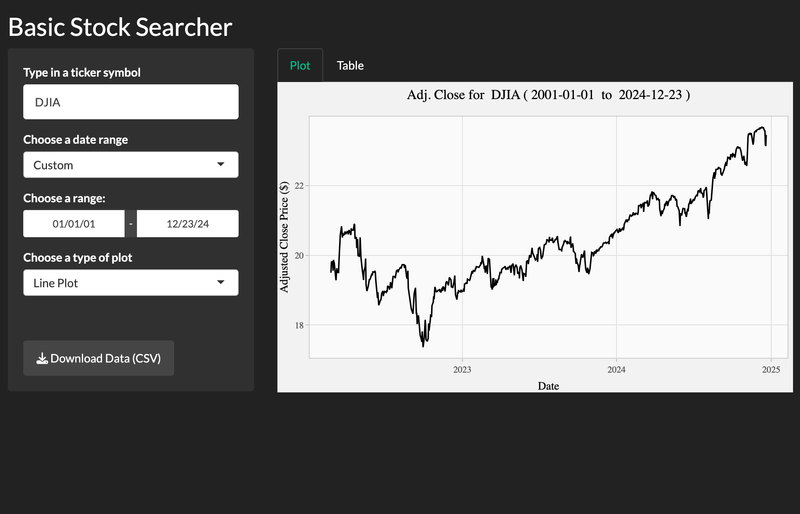
The basic stock searcher was a side project I built to learn R Shiny. The app lets a user type in a stock ticker and either choose from pre-set date ranges — last 3 months, year-to-date, last 5 years — or define a custom range.
From there, the app renders a graph of the ticker's adjusted close price over that period. Users can switch between a standard line chart, an area chart, or a red-green area chart that visually signals whether the price has risen or fallen since the start of the range.
Under the hood
Price data is pulled from Yahoo! Finance using the tidyquant package. Alongside the chart, users can view the underlying OHLCV (open, high, low, close, volume) data as a table and download it as a CSV. The chart itself is interactive — hovering over any point surfaces the exact adjusted close price for that date.